Table of Contents
Cybersecurity needs to be operated, which means that we are obligated to make its operation as straightforward as possible. Forrester recently underscored the importance of this aspect of SecOps in their report on the ‘Analyst Experience’ or AX. The new Lumu Incident View is the latest step in our constant effort not just to empower cybersecurity operators, but to make their most critical tasks easier.
Incident management is arguably the most critical SecOps task. While incident mitigation can be automated to some extent, remediation requires that cybersecurity operators put their decision-making superpowers to the test. Operators need to prioritize incidents based on the progression of attacks, the extent of the assets affected, their business relevance, and other contextual factors.
In the worst cases, incident decision making happens during time-sensitive, high-pressure situations. In the best cases, operators can detect compromises early on, recognize their threat, and handle them before they develop into headline-grabbing disasters.
The new Lumu Incident View is a single screen that places at the cybersecurity operator’s fingertips the tools and information that they need to outwit cybercriminals at every turn.
Lumu Incident View – A Single Operator Screen
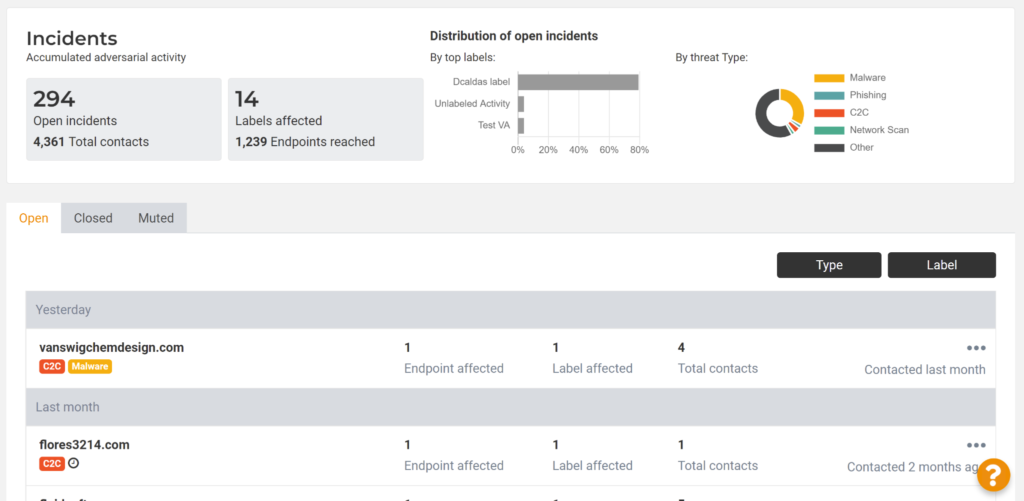
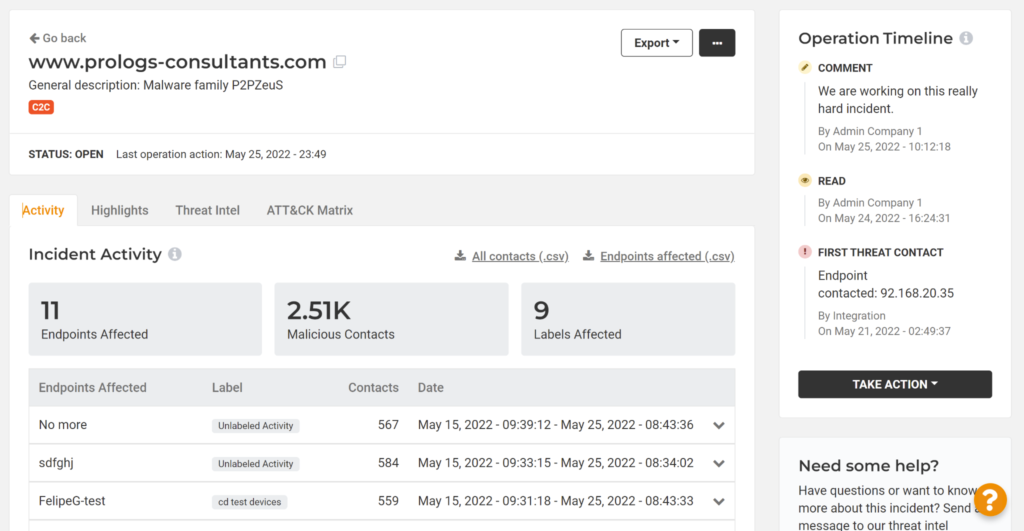
From the incidents screen (shown above), opening any one of the incidents shows you the new Lumu Incident View (see below). From every tab of the Incident View, you can take action (close, open, mute, or leave a comment) on the right. You’ll also see the actions taken by team members and their comments regarding this incident.
The first tab, ‘Activity’, gives a snapshot of the extent of the incident. Here you can pinpoint all the individual endpoints affected and how active those malicious contacts have been. You’ll also see the label the asset belongs to, to quickly understand its position within your network and its business relevance.
Clicking on an affected endpoint shows you more detail about its individual contacts. You can see the source of the detected contact–whether it was received from a DNS gateway, Lumu Virtual Appliance, Lumu agent, or 3rd party integration–along with the detail sent by that metadata collector. A third-party integration might include in its detail the action it took with regard to that contact. For example, a 3rd party firewall could tell you that it has already blocked that contact.
We’ve also added the ability to download the incident’s STIX files and .csv files of the contacts and the affected assets to aid in your remediation activities.
Prioritize Incidents with the Highlights Tab
The severity of an incident isn’t only a function of the number of contacts. The Highlights tab gives an overview of the business relevance of the incident. You can now see which labels have been affected by this incident.
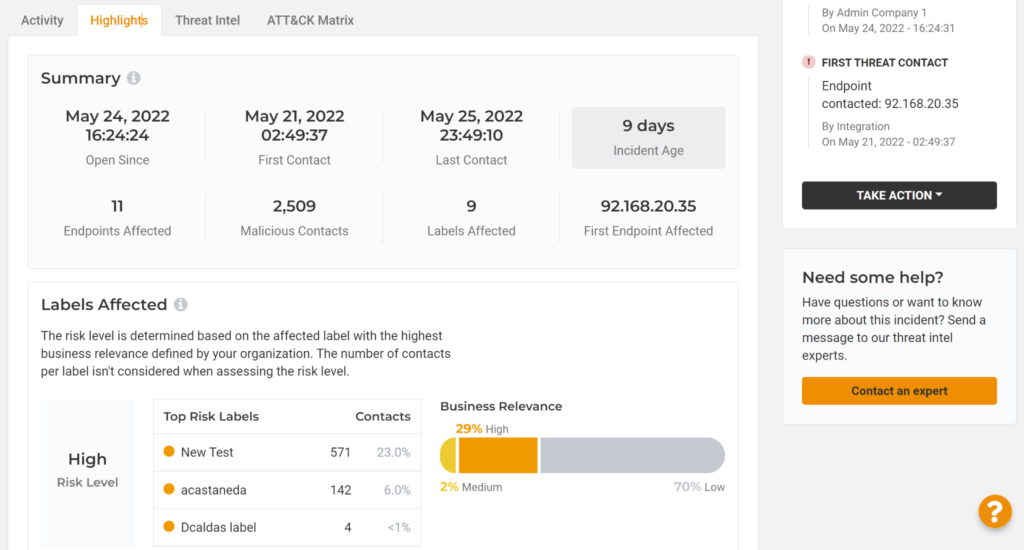
As a reminder, labels can be defined by you based on geography, department, or in whiochever way makes sense to your organization. You can also define the business relevance of these labels. For example, you might define assets in the marketing department to be of low business relevance, but the finance department and a server room to be of high business relevance.
With this new business relevance tool, you can quickly understand if an attack is intentionally moving towards more critical systems.
This tab also includes the Compromise Radar–a visual tool that lets you understand this incident’s contact patterns at a glance.
At the bottom of the tab you can find the Spambox Feature. Here you can learn more about how this incident’s instigators are using email-based attacks to target your network and users–as well as how successful they are.
Threat Intel on Each incident
The third tab of the Incident View contains all the threat intelligence related to the incident. Firstly, ‘Threat Triggers’ lists all the Indicators of Compromise (IoCs) and confirmed compromise intelligence that led to the incident being identified. All these triggers can be downloaded so you can incorporate them into your mitigation and remediation procedures.
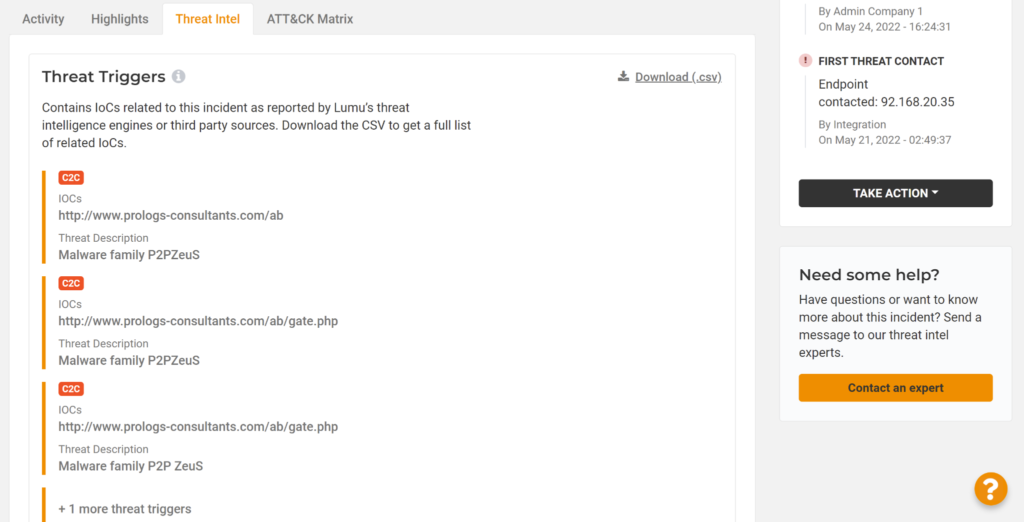
The Threat Intel tab also includes contextual resources related to this incident. For example, you can access 3rd-party blogs and analyses by cybersecurity operators who have already dealt with this incident, so you can learn from their experience. We also included playbooks (based on NIST guidelines) that give you a step-by-step guide on how to deal with this incident.
The Automated MITRE ATT&CK Matrix
The final tab includes shows the MITRE ATT&CK Matrix: the most comprehensive repository of adversarial tools, techniques, and procedures (TTPs).
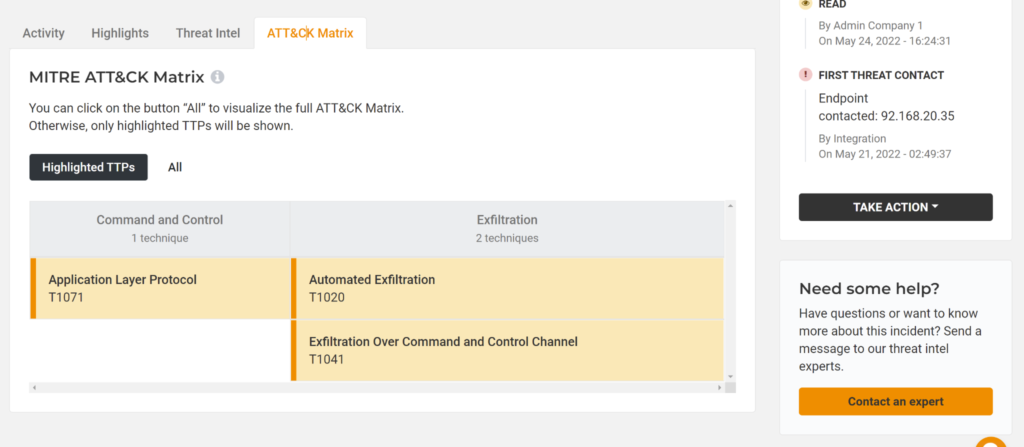
Lumu automates the ATT&CK Matrix so it doesn’t simply show all the TTPs (although you have the option to see them all). Instead, we show only the TTPs that are relevant to this attack. Consequently, you can understand the tools and techniques that the operators of this particular malware use at every stage of the incident.
Clicking on each of the TTPs gives its description and a link to more in-depth information on the MITRE website.
Test Drive the New Incident View at RSA Conference 2022
If you are coming to RSA Conference 2022 in San Francisco, you can experience hands-on how the new Incident View makes you feel like a cybersecurity superhero. Be sure to schedule a meeting at our booth to get a gift and a chance to win some awesome gadgets. We hope to see you there!


